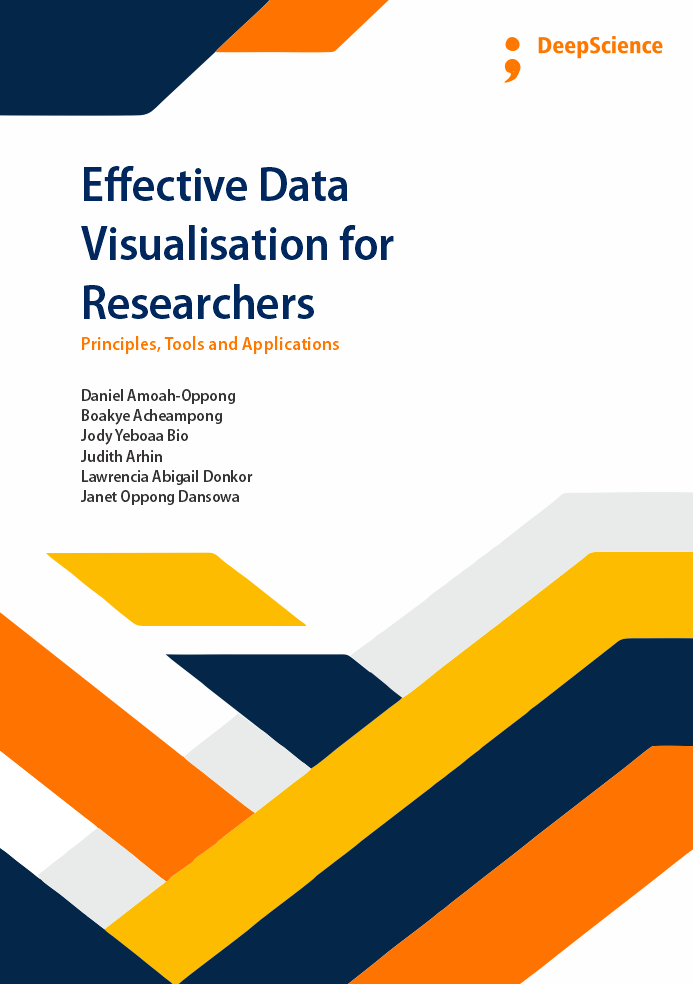
Effective Data Visualisation for Researchers: Principles, Tools and Applications
Keywords:
Data Visualisation, Research Communication, Scientific Visualization, Academic Publishing, Data Analytics, Infographics, Big DataSynopsis
The growing need for researchers to present their findings in a visually striking and academically rigorous way led to the development of this book. As PhD students in physical education and health promotion at the University of Cape Coast, we have seen firsthand the difficulties many students face in choosing the right visual tools to communicate their data effectively. This book has been written with a deliberate focus on accessibility and practicality. We tried to distil complex principles and technologies of visualisation into simplified, actionable knowledge, suitable for those at the beginning of their academic research careers.
While the focus is on academic research, the principles and procedures described in this piece can be extended to professional reports, trade presentations, and policy documents where data-driven reporting is essential. We hope that this book will not only improve the technical skills of the reader but also give them a deeper understanding of the role of visual literacy in the research process. We are grateful to our mentors, colleagues, and students for giving us feedback and support throughout this process. This book is for all researchers and readers who seek truth, meaning, and progress through the written word.
References
Börner, K., Bueckle, A., & Ginda, M. (2019). Data visualisation literacy: Definitions, conceptual frameworks, exercises, and assessments. Proceedings of the National Academy of Sciences, 116(6), 1857-1864.
https://doi.org/10.1073/pnas.1807180116
Burns, A., Lee, C., Chawla, R., Peck, E., & Mahyar, N. (2023, April). Who do we mean when we talk about visualisation novices? In Proceedings of the 2023 CHI Conference on Human Factors in Computing Systems, 1-16.
https://doi.org/10.1145/3544548.3581524
Cairo, A. (2016). The truthful art: Data, charts, and maps for communication. New Riders.
Chang, H. Y., Chang, Y. J., & Tsai, M. J. (2024). Strategies and difficulties during students' construction of data visualisations. International Journal of STEM Education, 11(1), 11.
https://doi.org/10.1186/s40594-024-00463-w
Choe, K., Jung, S., Park, S., Hong, H., & Seo, J. (2021, April). Papers101: Supporting the discovery process in the literature review workflow for novice researchers. In 2021 IEEE 14th Pacific Visualisation Symposium (PacificVis) (pp. 176-180). IEEE.
https://doi.org/10.1109/PacificVis52677.2021.00037
Douville, S., Grandjean Targos, P. T., Jones, N. D., Knight, C., & Azzam, T. (2025). Data visualisation expert lessons learned: Implications for program evaluators. American Journal of Evaluation, 10982140241290744.
https://doi.org/10.1177/10982140241290744
Few, S. (2012). Show me the numbers: Designing tables and graphs to enlighten (2nd ed.). Analytics Press.
Gafny, R., Dvir, M., & Ben-Zvi, D. (2025). Novices' reasoning with big data and data-ing through the lens of uncertainty. ZDM-Mathematics Education, 57(1), 137-152.
https://doi.org/10.1007/s11858-024-01646-z
Grammel, L., Tory, M., & Storey, M. A. (2010). How information visualisation novices construct visualisations. IEEE transactions on visualisation and computer graphics, 16(6), 943-952.
https://doi.org/10.1109/TVCG.2010.164
Healy, K. (2018). Data visualisation: A practical introduction. Princeton University Press.
Huang, O., Lee, P. Y. K., & Nobre, C. (2025). From Reality to Recognition: Evaluating Visualisation Analogies for Novice Chart Comprehension. In COMPUTER GRAPHICS forum (Vol. 44, No. 3).
https://doi.org/10.31219/osf.io/up6e5
Kargbo, H. A., & Turay, A. (2025). Enhancing Electoral Transparency in Sierra Leone through Data Visualisation and Mapping. International Journal of Innovative Science and Research Technology, 10(4), 3303-3314.
https://doi.org/10.38124/ijisrt/25apr1970
Kastens, K. A., Shipley, T. F., Boone, A. P., & Straccia, F. (2016). What Geoscience Experts and Novices Look At, and What They See, When Viewing Data Visualisations. Journal of Astronomy & Earth Sciences Education, 3(1), 27-58.
https://doi.org/10.19030/jaese.v3i1.9689
Kirk, A. (2019). Data visualisation: A handbook for data-driven design (2nd ed.). Sage Publications.
Maltese, A. V., Harsh, J. A., & Svetina, D. (2015). Data visualisation literacy: Investigating data interpretation along the novice-expert continuum. Journal of College Science Teaching, 45(1), 84-90.
https://doi.org/10.2505/4/jcst15_045_01_84
Parsons, P. (2021). Understanding data visualisation design practice. IEEE Transactions on Visualisation and Computer Graphics, 28(1), 665-675.
https://doi.org/10.1109/TVCG.2021.3114959
Resnick, I., Kastens, K. A., & Shipley, T. F. (2018). How students reason about visualisations from large professionally collected data sets: A study of students approaching the threshold of data proficiency. Journal of Geoscience Education, 66(1), 55-76.
https://doi.org/10.1080/10899995.2018.1411724
Stofer, K., & Che, X. (2014). Comparing experts and novices on scaffolded data visualisations using eye-tracking. Journal of Eye Movement Research, 7(5).
https://doi.org/10.16910/jemr.7.5.2
Ushizima, D., Santos, G. M. D., Sordo, Z., Pandolfi, R., & Donatelli, J. (2025). Ascribe New Dimensions to Scientific Data Visualisation with VR. arXiv preprint arXiv:2504.13448.
Wang, G., Noorhidawati, A., Yanti Idaya, A. M. K., & Yuan, Y. (2025). Navigating data visualisation: service landscapes and librarian roles in academic libraries. The Electronic Library.
https://doi.org/10.1108/EL-09-2024-0272
Zhang, I., Jia, Y., Cheng, X., Son, J. Y., & Stigler, J. W. (2025). Empowering Novice Programmers: Redesigning Documentation for Effective Informal Learning. Journal of Educational Computing Research, 07356331241311505.


